Best Log Management Platforms for Node.js SaaS Apps in 2026
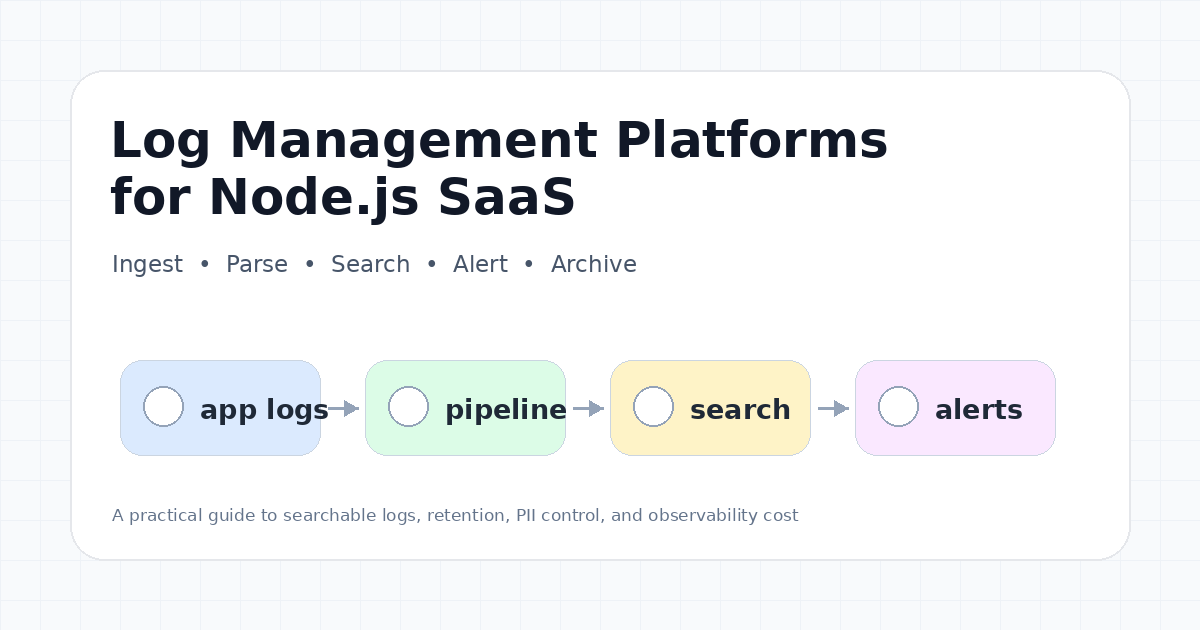
Logs are still the production debugging source of truth. Error tracking tells you that something failed. Metrics tell you that something moved. Traces show the request path. But logs often explain what actually happened: the request payload shape, the tenant context, the queue retry count, the webhook provider response, the feature flag state, and the exact branch of code that ran.
For a Node.js SaaS app, log management becomes critical as soon as you have more than one service, one worker, one deployment target, or one paying customer asking why something broke.
This guide compares the most practical log management platforms for Node.js SaaS teams in 2026: Datadog Log Management, Better Stack Logs, Axiom, Grafana Cloud Logs, and New Relic Logs. The focus is not just feature lists. The goal is to choose a logging architecture that keeps production debugging fast without letting log costs grow quietly in the background.
What Log Management Should Do for a Node.js SaaS App
A log management platform should do more than store lines of text. For a production Node.js SaaS product, it should help you answer:
- What happened before this error?
- Which tenant, user, request, worker, or webhook triggered it?
- Did this start after a deploy?
- Is the problem isolated to one customer or global?
- Which logs are worth indexing for fast search?
- Which logs can be archived cheaply?
- Are secrets, tokens, emails, card data, or personal data leaking into logs?
- Can alerts detect abnormal log patterns before customers report them?
The best platforms combine ingestion, parsing, indexing, search, alerting, retention controls, access control, and cost controls. The hard part is matching those capabilities to your actual operational workflow.
Quick Comparison Table
| Platform | Best Fit | Strengths | Watch Out For | Pricing Note |
|---|---|---|---|---|
| Datadog Log Management | Teams already using Datadog APM, metrics, infra, or security | Strong correlation with metrics, traces, monitors, RBAC, routing, archives, anomaly insights | Separate ingest, indexing, storage, and retention concepts make cost design critical | Ingest from ~$0.10/GB; standard indexing from ~$1.70 per million log events for 15-day retention |
| Better Stack Logs | Startups and SaaS teams wanting logs plus uptime, incidents, status pages, and on-call | Simple bundled telemetry, ClickHouse-based workflow, incident management integration, generous starter bundles | Bundled pricing may be less flexible for unusual log-only workloads | Free personal plan (3GB/3 days); telemetry bundles from Nano to Tera with 30-day retention |
| Axiom | Developer-first teams needing fast query and high-volume event analytics | Generous free ingest (500GB/month), fast event search, dashboards, monitors, transparent usage model | Query compute and enterprise add-ons matter at scale | Personal free forever; Axiom Cloud with storage and compute pricing |
| Grafana Cloud Logs | Teams that like Grafana, Loki, Prometheus, and open-source observability | Managed Loki, Grafana dashboards, Adaptive Logs, strong open-source ecosystem | Query patterns and label design are critical; Loki differs from full-text search engines | Free tier: 50GB/month, 14-day retention; Pro logs from ~$0.05/GB processed |
| New Relic Logs | Teams already using New Relic for full-stack observability | Unified platform, 100GB/month free data ingest, logs obfuscation, broad observability features | User pricing and data ingest pricing both affect total bill | 100GB free/month; ~$0.40/GB beyond free for original data ingest |
1. Datadog Log Management
Datadog is a strong choice when logs need to live inside a broader observability and security workflow. Its log management covers ingest, processing, enrichment, live tail, archives, log-based metrics, RBAC, cost allocation tags, dynamic routing, indexing, log monitors, anomaly insights, and long-term flex storage.
For Node.js SaaS teams already using Datadog APM, infrastructure monitoring, synthetics, RUM, or security products, the main benefit is correlation. A production incident can connect logs to traces, metrics, deployments, dashboards, alerts, and service ownership in one place.
When Datadog Is a Good Fit
- You already use Datadog for APM or infrastructure monitoring.
- You need logs, traces, metrics, security signals, and alerts in one place.
- You need RBAC, team ownership, and cost allocation tags.
- You want log-based metrics and monitors.
- You have high-value operational logs that must be searchable in real time.
What to Configure Carefully
Datadog can be powerful and expensive if every debug line is indexed forever. Design your log routing before volume grows:
// Structured JSON log with correlation fields for Datadog
import pino from 'pino';

const logger = pino({
  level: process.env.LOG_LEVEL ?? 'info',
  formatters: {
    level(label) {
      return { severity: label };
    },
  },
  mixin() {
    return {
      service: 'api-gateway',
      environment: process.env.NODE_ENV,
      release: process.env.GIT_SHA?.slice(0, 7),
    };
  },
});

// In a request handler
app.use((req, res, next) => {
  req.log = logger.child({
    request_id: req.id,
    trace_id: req.headers['x-trace-id'],
    tenant_id: req.headers['x-tenant-id'],
    route: req.route?.path,
  });
  next();
});
A practical setup is to ingest broadly, index selectively, archive cold logs, and create log-based metrics for long-term trend analysis. Node.js apps should tag logs with service, environment, release, tenant, request_id, trace_id, route, status_code, and severity.
2. Better Stack Logs
Better Stack is attractive for SaaS teams that want logs, uptime monitoring, incident management, on-call, status pages, error tracking, tracing, and metrics in a simpler startup-friendly platform. It is known for its ClickHouse-based log search workflow, which feels approachable for teams that do not want to manage Elasticsearch, Loki, or a large observability suite.
When Better Stack Is a Good Fit
- You want log management and incident response together.
- You need a simple platform for a small SaaS team.
- You want uptime monitoring, status pages, on-call, and logs in one workflow.
- You prefer bundled pricing over separate ingest and indexing knobs.
- You do not want a complex enterprise observability rollout.
What to Evaluate
Check whether the bundle sizes match your actual telemetry mix. Some Node.js apps generate many logs but few traces; others generate heavy metrics and replay data. Bundles simplify buying, but unusual workloads may need careful cost modeling.
// Sending structured logs to Better Stack via their HTTP source
const BETTER_STACK_SOURCE_TOKEN = process.env.BETTER_STACK_SOURCE_TOKEN;

async function sendLog(level: string, message: string, meta: Record<string, unknown>) {
  await fetch(`https://in.logs.betterstack.com`, {
    method: 'POST',
    headers: {
      'Content-Type': 'application/json',
      'Authorization': `Bearer ${BETTER_STACK_SOURCE_TOKEN}`,
    },
    body: JSON.stringify({
      dt: new Date().toISOString(),
      level,
      message,
      ...meta,
    }),
  });
}
3. Axiom
Axiom is a developer-first event and log analytics platform. Its Personal plan is free forever, includes 30-day retention, no credit card requirement, and up to 500GB monthly data ingest. Axiom Cloud adds always-free storage, data loading, query compute allowances, and enterprise add-ons such as SAML SSO, directory sync, RBAC, and audit logs.
For Node.js SaaS teams, Axiom is interesting because it treats logs as event data that should be easy to query, stream, monitor, and dashboard.
When Axiom Is a Good Fit
- You want fast developer-friendly querying.
- You need generous ingest for development, staging, or early production.
- You want event analytics beyond traditional log lines.
- You are comfortable thinking in datasets, fields, and query compute.
- You care about transparent self-serve pricing.
What to Watch
Axiom’s model includes storage, data loading compute, and query compute. That can be very efficient, but teams should understand how heavy dashboards, monitors, and ad-hoc queries affect costs. Also confirm enterprise add-ons if you need SSO, RBAC, audit logs, or support SLAs.
// Ingest structured events to Axiom via their HTTP API
const AXIOM_TOKEN = process.env.AXIOM_API_TOKEN;
const AXIOM_DATASET = 'production-logs';

async function ingestToAxiom(events: Record<string, unknown>[]) {
  await fetch(`https://api.axiom.co/v1/datasets/${AXIOM_DATASET}/ingest`, {
    method: 'POST',
    headers: {
      'Authorization': `Bearer ${AXIOM_TOKEN}`,
      'Content-Type': 'application/json',
    },
    body: JSON.stringify(events.map((e) => ({
      _time: new Date().toISOString(),
      ...e,
    }))),
  });
}
4. Grafana Cloud Logs
Grafana Cloud Logs is based on Grafana Loki, a log aggregation system designed around labels and efficient storage. It offers a free tier with 50GB ingested per month and 14-day retention, plus Pro pricing starting at $0.05/GB processed. Adaptive Logs helps you pay only for useful data by recommending which logs to drop or sample.
Grafana Cloud is a natural choice for teams that already use Grafana dashboards, Prometheus metrics, Loki logs, and open-source observability patterns.
When Grafana Cloud Logs Is a Good Fit
- You already use Grafana dashboards.
- Your team likes the Loki and Prometheus ecosystem.
- You want managed logs without operating Loki yourself.
- You care about open-source portability.
- You want Adaptive Logs recommendations for reducing noise.
What to Design Carefully
Loki is label-oriented. Poor label design can hurt performance and cost:
// Good: use stable dimensions as labels, keep high-cardinality fields as structured fields
import { createLogger, format, transports } from 'winston';

const logger = createLogger({
  level: 'info',
  format: format.combine(
    format.timestamp(),
    format.json()
  ),
  defaultMeta: {
    // Labels (low cardinality) — attach via Loki's relabel config or log pipeline
    service: 'payment-worker',
    environment: 'production',
    region: 'us-east-1',
    severity: 'info',
  },
  transports: [new transports.Console()],
});

// High-cardinality fields stay inside the log line, not as Loki labels
logger.info('Payment processed', {
  request_id: 'req_abc123',   // high cardinality — field, not label
  tenant_id: 'ten_xyz789',     // high cardinality — field, not label
  amount_cents: 4999,
  currency: 'USD',
});
Do not put high-cardinality fields such as user IDs, request IDs, or unique order IDs into labels without understanding the impact. Keep those as log fields, and use labels for stable dimensions such as service, environment, region, and severity.
5. New Relic Logs
New Relic offers simple usage-based pricing with 100GB of free data ingest per month, unlimited free basic users, and access to 50+ capabilities. Beyond the free tier, it charges $0.40/GB for original data ingest and $0.60/GB for Data Plus, with advanced logs obfuscation and extended retention options.
For Node.js SaaS teams that already use New Relic APM, logs fit naturally into the same platform as traces, metrics, alerts, synthetic checks, and dashboards.
When New Relic Is a Good Fit
- You already use New Relic for APM or infrastructure monitoring.
- You want unified telemetry with a simple ingest-based model.
- You need broad observability features without per-host pricing.
- You want logs connected to application performance and errors.
- You value built-in logs obfuscation and data governance features.
What to Verify
New Relic pricing depends on data ingest, user types, edition, compute options, and optional Data Plus. For a Node.js team, the free 100GB/month can be enough to start, but production volume can grow quickly if debug logs, request bodies, or verbose worker logs are not controlled.
Recommended Node.js Logging Architecture
A good Node.js logging architecture starts before you choose a vendor. Use this pattern:
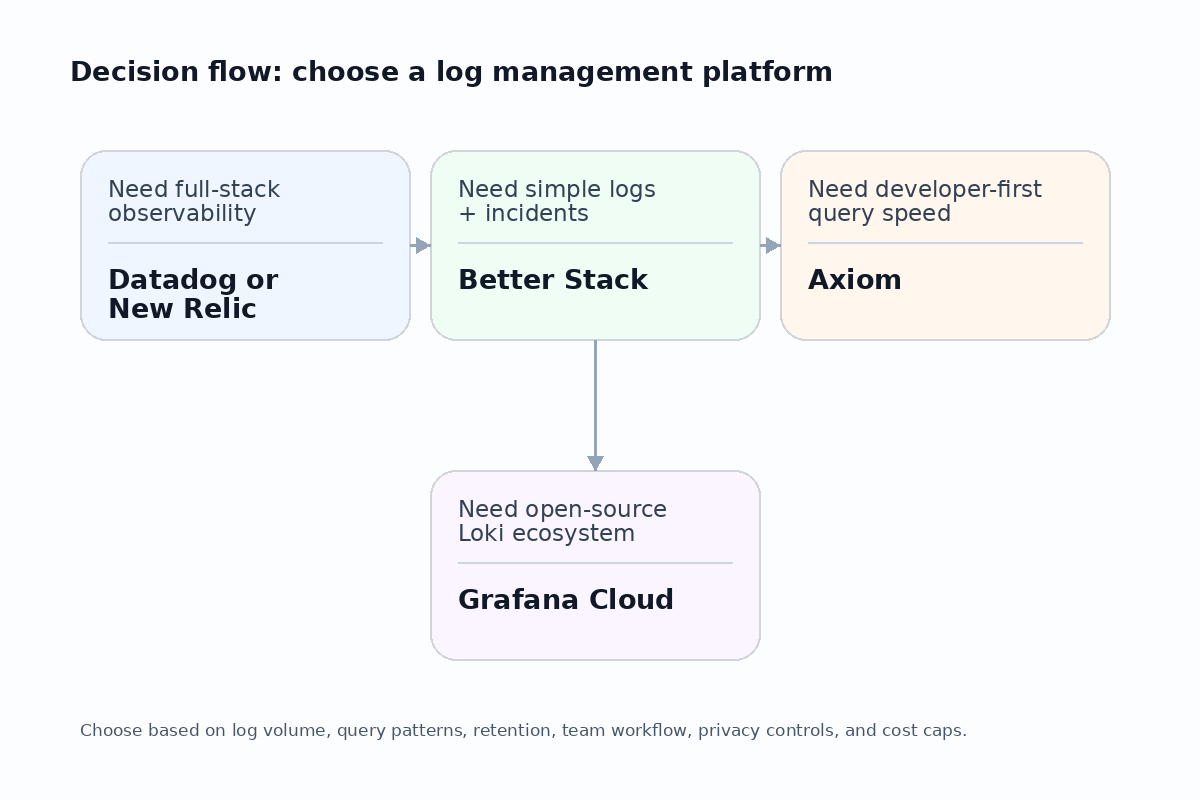
- Emit structured JSON logs from the application.
- Use consistent fields across API routes, workers, cron jobs, and webhooks.
- Include
request_id,trace_id,tenant_id,service,environment,release,route,status_code,duration_ms, andseverity. - Redact secrets, tokens, passwords, card data, authorization headers, cookies, and personal data before logs leave your app or pipeline.
- Route high-value operational logs to hot search indexes.
- Route low-value or compliance-only logs to cheaper retention or archive storage.
- Create alerts from patterns, not every single log line.
- Review log volume weekly after major releases.
A Production-Grade Structured Logger
// logger.ts — production structured logger with Pino + redaction
import pino from 'pino';

const REDACTED_FIELDS = new Set([
  'password', 'token', 'secret', 'authorization',
  'cookie', 'credit_card', 'ssn', 'api_key',
]);

function redactSensitive(obj: Record<string, unknown>): Record<string, unknown> {
  const result: Record<string, unknown> = {};
  for (const [key, value] of Object.entries(obj)) {
    if (REDACTED_FIELDS.has(key)) {
      result[key] = '[REDACTED]';
    } else if (typeof value === 'object' && value !== null && !Array.isArray(value)) {
      result[key] = redactSensitive(value as Record<string, unknown>);
    } else {
      result[key] = value;
    }
  }
  return result;
}

export const logger = pino({
  level: process.env.LOG_LEVEL ?? 'info',
  formatters: {
    level(label) {
      return { severity: label };
    },
  },
  serializers: {
    req: (req) => ({
      method: req.method,
      url: req.url,
      headers: redactSensitive(req.headers || {}),
    }),
  },
  mixin() {
    return {
      service: process.env.SERVICE_NAME ?? 'nodejs-api',
      environment: process.env.NODE_ENV ?? 'development',
      release: process.env.GIT_SHA?.slice(0, 7),
    };
  },
});

// Middleware to attach correlation IDs
import { Request, Response, NextFunction } from 'express';
import { v4 as uuidv4 } from 'uuid';

export function loggingMiddleware(req: Request, res: Response, next: NextFunction) {
  const requestId = uuidv4();
  const traceId = (req.headers['x-trace-id'] as string) || requestId;
  const tenantId = req.headers['x-tenant-id'] as string | undefined;
  const start = Date.now();

  (req as any).log = logger.child({
    request_id: requestId,
    trace_id: traceId,
    tenant_id: tenantId,
    route: req.route?.path || req.path,
  });

  res.on('finish', () => {
    (req as any).log.info({
      status_code: res.statusCode,
      duration_ms: Date.now() - start,
      user_agent: req.headers['user-agent'],
    }, `${req.method} ${req.path}`);
  });

  next();
}
Use a structured logger such as Pino or Winston, but do not confuse a logging library with log management. The library emits logs. The platform stores, searches, alerts, retains, and governs them.
PII and Secret Redaction Pipeline
Redaction should happen before logs leave your application or enter the vendor pipeline:
// Middleware to strip sensitive data from request bodies before logging
const SENSITIVE_KEYS = [
  'password', 'token', 'secret', 'authorization',
  'cookie', 'set-cookie', 'x-api-key', 'credit_card',
  'card_number', 'cvv', 'ssn', 'passport',
];

function sanitizeBody(body: unknown, depth = 0): unknown {
  if (depth > 10) return '[MAX_DEPTH]';
  if (typeof body !== 'object' || body === null) return body;
  if (Array.isArray(body)) return body.map((item) => sanitizeBody(item, depth + 1));

  const sanitized: Record<string, unknown> = {};
  for (const [key, value] of Object.entries(body as Record<string, unknown>)) {
    const lower = key.toLowerCase();
    if (SENSITIVE_KEYS.some((k) => lower.includes(k))) {
      sanitized[key] = '[REDACTED]';
    } else if (typeof value === 'string' && value.length > 500) {
      sanitized[key] = `${value.slice(0, 500)}... [TRUNCATED]`;
    } else {
      sanitized[key] = sanitizeBody(value, depth + 1);
    }
  }
  return sanitized;
}
Cost Factors and Retention Strategy
Log costs usually grow for three reasons: too much ingest, too much indexing, and too much retention. Compare platforms across these cost drivers:
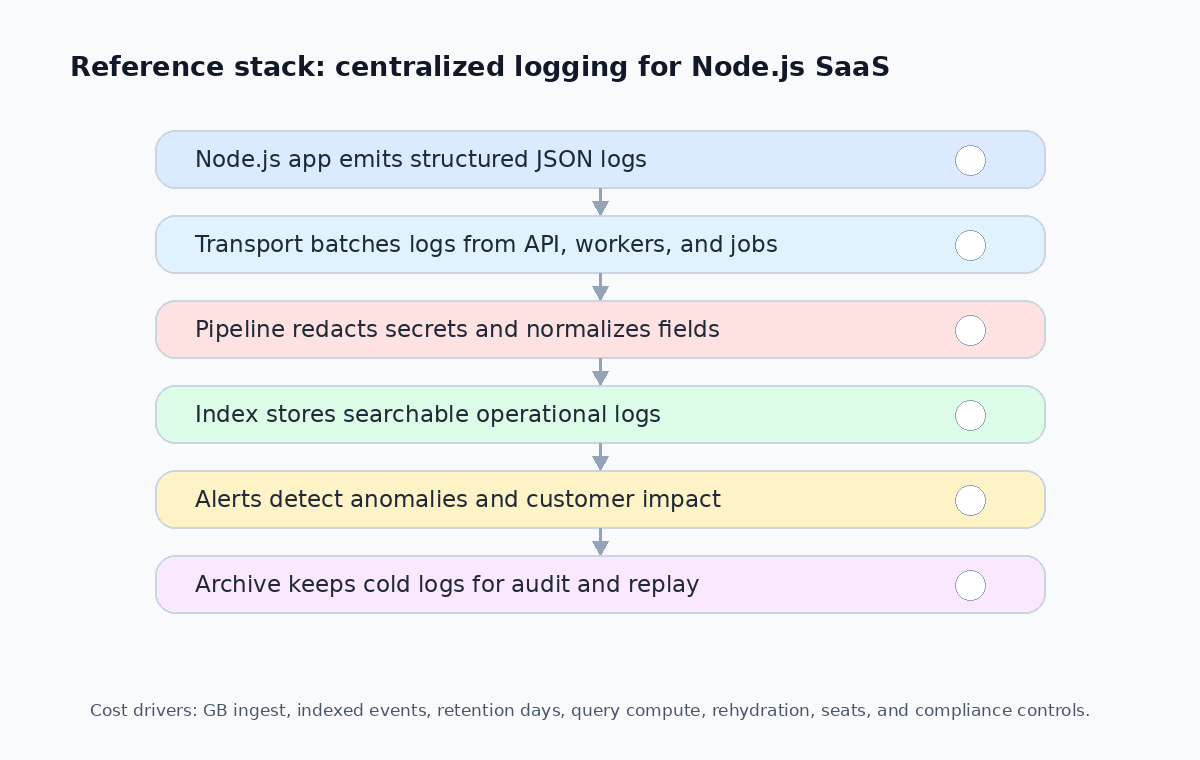
| Cost Driver | Why It Matters | Mitigation |
|---|---|---|
| GB ingested per month | Directly drives vendor bills | Sample noisy logs, drop duplicate debug output, reduce log verbosity in production |
| Events indexed for fast search | Hot indexes are the most expensive tier | Index only error/warning/critical; route info/debug to cheaper storage |
| Retention days for hot logs | Longer retention = higher cost | Keep production errors 15–30 days; archive older logs |
| Cold archive storage | Cheaper but may have rehydration costs | Use for compliance, audit, and long-term investigation |
| Rehydration or scan cost | Accessing archived logs can cost money | Model rehydration costs when choosing archive frequency |
| Query compute | Heavy dashboards and ad-hoc queries add up | Limit dashboard refresh rates; optimize LogQL/PromQL queries |
| Number of users or seats | Some platforms charge per user | Use read-only viewers where possible |
| SSO, RBAC, audit logs, compliance | Enterprise features often cost extra | Confirm before scaling to enterprise tier |
A Practical Retention Strategy
- Keep production error and warning logs searchable for 15–30 days.
- Keep high-value audit logs longer, but not necessarily in a hot index.
- Sample or drop noisy debug logs in production.
- Store request bodies only when explicitly needed and confirmed safe.
- Archive cold logs for compliance, replay, or investigation.
- Track log volume per service and tenant with a weekly review.
// Log sampling helper — drop noisy debug logs in production
function shouldLog(level: string, route: string): boolean {
  if (level === 'debug') {
    // In production, sample only 1% of debug logs
    return Math.random() < 0.01;
  }
  if (route === '/health' || route === '/ready') {
    // Drop health-check noise entirely
    return false;
  }
  return true;
}

logger.debug({ sampled: true }, 'Cache miss for tenant lookup'); // only logged ~1% of the time
Recommendations by Use Case
If You Already Use Datadog
Choose Datadog Log Management. The correlation with APM, metrics, dashboards, monitors, and service ownership is usually worth the integration cost. Just design indexing and retention carefully before volume grows.
If You Want a Startup-Friendly All-in-One Platform
Choose Better Stack. It is a strong fit for small SaaS teams that want logs, incidents, uptime, status pages, and on-call in one place without a heavy enterprise rollout.
If You Want Developer-First High-Volume Log Analytics
Choose Axiom. It is especially attractive for teams that want fast queries, generous free ingest (500GB/month), and event-style analytics without credit card gates.
If You Like Grafana and Open-Source Observability
Choose Grafana Cloud Logs. It is the natural managed path for teams already using Grafana, Prometheus, and Loki-style workflows. Adaptive Logs helps keep costs under control.
If You Already Use New Relic APM
Choose New Relic Logs. The 100GB/month free ingest and unified platform can be attractive, especially if your team already investigates performance issues in New Relic.
Common Implementation Mistakes
Mistake 1: Logging Unstructured Strings
Unstructured logs are hard to filter, aggregate, alert on, and cost-control. Always use JSON logs with consistent field names.
// ❌ Bad: unstructured
console.log(`User ${userId} created order ${orderId} for $${amount}`);

// ✅ Good: structured
logger.info({ user_id: userId, order_id: orderId, amount_cents: amount }, 'Order created');
Mistake 2: Logging Secrets and Personal Data
Never log tokens, authorization headers, passwords, cookies, card data, or unnecessary personal data. Redaction should be part of the logging pipeline, not a manual afterthought.
Mistake 3: Indexing Everything Forever
Hot indexes are expensive. Archive low-value logs and index only what needs fast search, dashboards, or alerts.
Mistake 4: Ignoring Background Jobs
Queues, cron jobs, webhook retries, imports, exports, and billing tasks often explain production failures. Give them the same structured logging discipline as API routes:
// Worker with structured logging
import { Worker, Job } from 'bullmq';

const paymentWorker = new Worker('payments', async (job: Job) => {
  const childLogger = logger.child({
    job_id: job.id,
    job_name: job.name,
    tenant_id: job.data.tenantId,
    attempt: job.attemptsMade + 1,
  });

  childLogger.info({ payload: sanitizeBody(job.data) }, 'Payment job started');

  try {
    await processPayment(job.data);
    childLogger.info({ duration_ms: Date.now() - job.timestamp }, 'Payment job completed');
  } catch (err) {
    childLogger.error({ err, stack: (err as Error).stack }, 'Payment job failed');
    throw err;
  }
});
Mistake 5: Not Linking Logs to Traces and Releases
Logs are much more useful when they include trace IDs, request IDs, release IDs, and deployment metadata. Without those fields, every investigation starts with manual correlation.
FAQ
Do Node.js SaaS apps need log management if they already use error tracking?
Yes. Error tracking groups exceptions, but log management captures the broader operational timeline. Logs are where you see webhook payload decisions, retries, queue processing, tenant-specific behavior, feature flag branches, security events, and background job details — context that error trackers do not surface.
What is the best log format for a Node.js SaaS app?
Structured JSON logs are the best default. They preserve fields such as request_id, trace_id, tenant_id, user_id, service, environment, route, status_code, duration_ms, release, and severity. Those fields make search, alerting, dashboards, and cost allocation much easier than parsing unstructured strings.
How can teams reduce log management costs without losing debuggability?
Reduce costs by sampling noisy logs, dropping duplicate debug output, redacting sensitive data before ingest, routing only high-value logs to hot indexes, shortening retention for low-value logs, archiving cold logs separately, and tracking log volume by service and tenant on a weekly cadence.
Conclusion
The best log management platform for a Node.js SaaS app depends on your existing observability stack and cost tolerance. Choose Datadog if you already live in Datadog. Choose Better Stack if you want a startup-friendly all-in-one workflow. Choose Axiom if fast event querying and generous ingest matter. Choose Grafana Cloud if you like Loki and open-source observability. Choose New Relic if your team already uses New Relic APM and wants unified telemetry.
The most important decision is not the vendor. It is the logging model. Emit structured logs, preserve correlation IDs, redact sensitive data, separate hot logs from cold archives, and measure logging cost before it becomes invisible infrastructure debt.